Insights
Enhancing Automated Product Classification for E-Commerce Through Image Recognition

The e-commerce industry is experiencing rapid growth, and as machine learning continues to evolve, the integration of these two fields is becoming increasingly significant. Consumers typically experience this through tailored product recommendations powered by sophisticated algorithms. Another critical element enhancing e-commerce is its capacity to ease product searches for consumers, ensuring they can locate items where they expect to find them. Behind the scenes, these products are organized in e-catalogs or product information management (PIM) systems. This leads to the concept of product taxonomies, which are hierarchical frameworks that categorize products accordingly. Visually, these taxonomies can be depicted as tree structures (Kim, Lee, Chun, & Lee, 2006), as illustrated in figure 1.

A product taxonomy allows for the breakdown of various subcategories, which would guide a customer to all Adidas Predator soccer shoes in this case. One of the notable advantages of e-commerce platforms is their vast virtual shelf space, enabling consumers to peruse a large selection of products (Elberse, 2008). However, categorizing these products within the taxonomy often remains a manual process for many businesses, requiring substantial time investment. An increasing number of companies are now transitioning to automated product classification, using artificial intelligence for this task. Specifically, machine learning techniques are employed, allowing firms to delegate this duty to specialists like us. Automation significantly enhances time efficiency and reduces costs.

Recently, we deployed one of our latest algorithms for product classification for a client who provided both textual data and product images. Typically, product classification relies mainly on textual data, as this method tends to yield satisfactory results. However, integrating images with textual descriptions shows great potential! This hybrid approach, which combines multiple algorithms to handle both text and image data, results in enhanced classification accuracy.

You might ask: ‘Why is it essential to use various algorithms for classification?’ The answer lies in the diverse nature of the data, often referred to as multimodal learning (Lahat, Adali, & Jutten, 2014; Ngiam, Khosla, Kim, Nam, Lee, & Ng, 2011). Srivastava and Salakhutdinov (2012) highlighted the difference between data types by stating: ‘Text is generally illustrated as discrete, sparse vectors of word counts, while images utilize pixel intensities or results from feature extractors, which are dense and real-valued’ (p.1). Thus, a strategy that aligns these data sources as equal or complementary is vital. Complementarity means that each data source contributes uniquely to the collective analysis, insights that cannot be gleaned from a single source alone (Lahat et al., 2014). In summary, the aim of multimodality is to achieve a synergy where the combined effect is greater than the individual contributions.
The hybrid framework fostering this synergy between text and image can be envisioned as a pyramid structure, with a foundational layer and a pinnacle layer. The foundation comprises two algorithms targeting text and image data, respectively. The outputs from this foundational layer feed into a top layer consisting of a singular algorithm that produces the final predictions regarding product classifications. A simplified model of the hybrid system is showcased in figure 3, with further details to follow later.
The illustration indicates two distinct inputs channeling into separate classifiers. The outputs of these classifiers then feed into a meta-learner—another classification algorithm—culminating in the predicted product classes.
What is depicted in figure 3 is a type of ensemble model. Ensemble models emerge from ensemble learning principles (Džeroski & Ženko, 2004), which focus on creating functioning models from existing classifiers. Non-technically, ensemble models can be likened to human decision-making. When facing significant choices, we often weigh several perspectives before concluding. This reasoning is analogous to how ensemble models operate, where ‘the essence of ensemble methodology is to evaluate various individual classifiers and merge them to achieve a classifier that exceeds the performance of each one individually’ (Rokach, 2010, p. 1). Thus, an ensemble model seeks to enhance the service we provide to our clients.
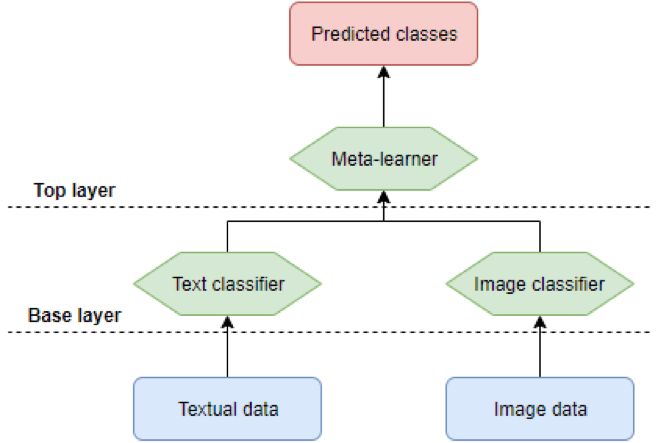
Ensemble learning comprises various architectures to construct an ensemble, including bagging, boosting, and stacking. Here, we will only cover stacking, but you can easily find more information on the two previous architectures through a quick Google search . Moving on to stacking, the ensemble architecture we adopted for product classification, the outcomes from the classifiers in the base layer serve as inputs for the classifier in the upper layer. These base classifiers can be heterogeneous (Graczyk, Lasota, Trawiński, & Trawiński, 2010), utilizing different models and datasets. The outputs from base-level classifiers might represent either predicted classes or the probabilities of each product belonging to various categories. Examples of each output format are presented in the table below.
| Product information | Class 1 - Adidas Predator football shoes | Class 2 | Class 3 | Class 4 | Class 5 |
|---|---|---|---|---|---|
| Adidas, AI2018, Synthetic, FG – fixed studs, Black | 1 | 0 | 0 | 0 | 0 |
| Adidas, AI2018, Synthetic, FG – fixed studs, Black | 0.80 | 0.30 | 0.10 | 0.20 | 0.01 |
Figure 4: Two potential output types {.small}
Our Methodology
As illustrated, the outputs from the base level classifiers can lead to either a definitive class prediction or provide probabilities for each class. These outputs serve as inputs for the meta-learner, reflecting the predictions for each class in one of the specified formats. Considering the example above with five distinct classes, the input comprises these five features, which the final predictions are derived from. Consequently, we have effectively merged textual and image data, establishing synergy that has resulted in a more efficient product classification service!
As elaborated, our ensemble model employs distinct classifiers for each data type and integrates them with an additional classifier to amalgamate both data sources. Subsequent sections will detail each classifier in our approach.
Text Classifier
The textual data available can be relatively easily classified using either straightforward algorithms like k-nearest neighbors or more intricate ones such as neural networks. In our methodology, we set up a system to evaluate several classifiers and select the highest-performing one (in terms of the overall accuracy of the ensemble model) as the text classifier. This could mean, for example, that while logistic regression fares well on its own, the best accuracy is achieved with k-nearest neighbors in the full ensemble model.
To utilize these classifiers for classification, a series of text preprocessing steps is necessary. It’s routine to apply the bag-of-words (BoW) method, which represents all unique words present in the dataset. To enhance the richness of this bag, we perform processing techniques like removing stop words, applying lemmatization, among others. This process results in a more informative BoW, which should consequently improve classification accuracy. Enhanced methodologies such as CountVectorizer and TfidfTransformer are utilized, with the latter computing a weighted frequency score based on a word’s frequency in relation to its occurrence throughout the dataset. The training and testing of each classifier follow a standard procedure, as depicted in figure 5 ( Credits ).
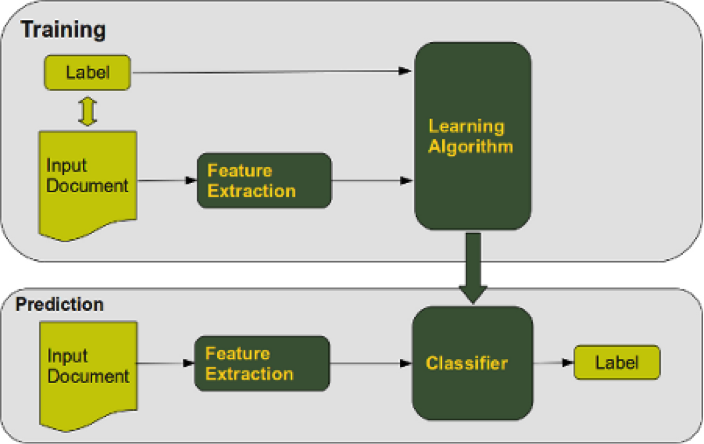
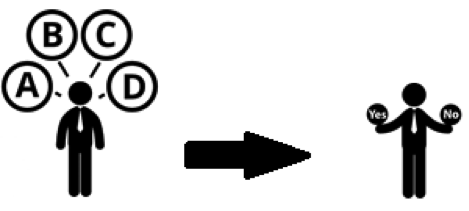
Within this framework, the label corresponds to the product category, while the input document represents the textual product details and the features comprise unique words from each description (shown with their TF-IDF score). A unique aspect of our system is the application of the One-Versus-Rest (OVR) strategy, meaning that classification occurs by comparing one class against all others. This differs from the common method of contrasting each class with others: instead of asking, “Does this product belong to class A, B, C or D?”, we now inquire: “Does this product belong to class A or any other class?”
Once the classifier has been trained and validated, it produces predictions for the validation dataset. These predictions can either be specific classifications or class probabilities (as earlier stated). We observed that utilizing probabilities resulted in higher accuracy scores for the ensemble model; therefore, probabilities for each class are used as inputs for the meta-learner.
Image Classifier
Next is the image dataset, for which we’ve selected a sophisticated classification algorithm. Significant advancements in computer vision stem from various neural network architectures like AlexNet , triggering renewed interest in neural networks, and later advancements like Inception Resnet V2 . These models outperform traditional approaches, such as logistic regression, for most tasks.
A challenge arises with these models as they generally require a significant number of images for training—often thousands per class. In our client’s case, their dataset contained at most hundreds of products per class, with many classes having fewer than a hundred. Thankfully, models like AlexNet are pretrained on millions of images across thousands of classes, allowing for the application of a technique called transfer learning. See figure 7 ( Credits ).
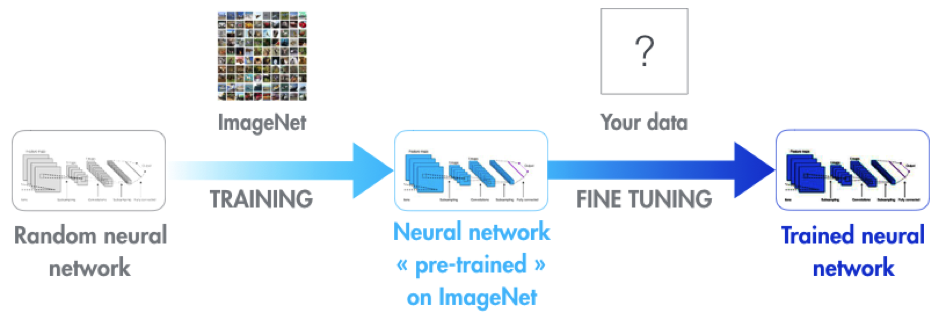
In essence, this means leveraging a pre-trained model and applying it to a new dataset, even when much smaller. Adjustments can still be made to recognize domain-specific features, since the fundamental features—like edges and corners—are already established in the model. This often yields satisfactory outcomes, which holds true in this scenario as well!
The image classifier chosen for our ensemble is the Inception ResNet V2, favored for its accessibility, ease of implementation with Python’s TensorFlow, and state-of-the-art status. This model requires images to be of a fixed size of 299*299 for height and width. Thus, we’ve implemented preprocessing steps to accommodate this requirement since our dataset’s images varied in size. Each image is resized accordingly, using a method called padding to ensure the aspect ratio is maintained, filling any excess space with black pixels, which does not affect the neural network’s classification process.
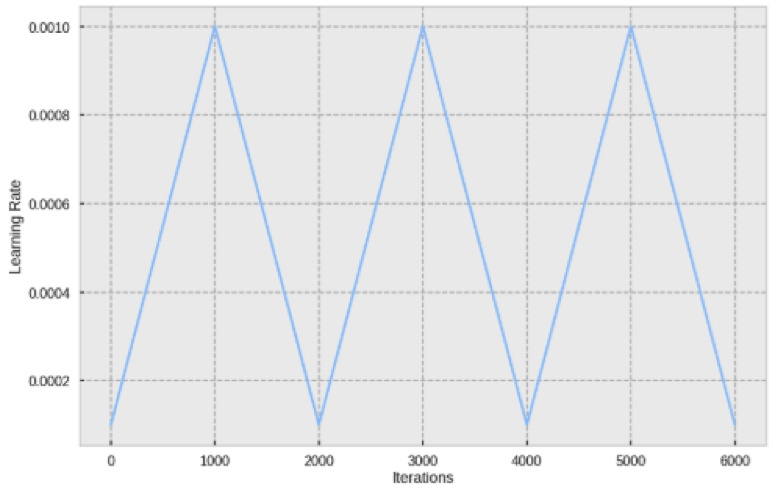
Once the images have been padded and resized while retaining their aspect ratio, the training process begins. While we are fine-tuning the existing model via transfer learning, it’s crucial to adjust the network’s parameters, especially the learning rate, which dictates the convergence speed toward an optimal solution. Although a trial-and-error method is common for establishing the learning rate, more organized approaches are available. One such strategy is the Cyclical Learning Rate (Smith, 2017), helping determine optimal minimum and maximum learning rates by cycling between them during training—often resulting in faster, more effective outcomes.
In figure 8 ( Credits ), the learning rate is cycled between 0.0001 and 0.0010 while executing 6000 iterations on the data.
After training and testing the image classifier, we input the validation set to obtain actual predictions. These predictions similarly take the form of predicted probabilities for each class per product and are used as input for the meta-learner. We now proceed to the final segment of our ensemble model: the meta-learner.
Meta-Learner
Having discussed the base level classifiers for text and images, we move to the next phase. After they fulfill their roles by offering predicted probabilities, these are fed into the meta-learner. Given that our client’s dataset comprises about 400 unique classes, we accumulate roughly 800 features. Since the meta-learner operates as another classification algorithm, we opted for a Support Vector Machine (SVM) because of its strong performance on classification tasks with vast feature sets (Joachims, 1998). This simplifies the classification task to generating actual class predictions rather than probabilities.
Final Model
Earlier, we noted testing various text classifiers to determine which classifier combination yields optimal classification accuracy. This approach is underscored by the no free lunch theorem, illustrating that there isn’t a ‘one algorithm to rule them all’. Algorithms perform differently based on datasets, so experimenting with multiple algorithms is beneficial. Our best-performing classifier ensemble is displayed below.
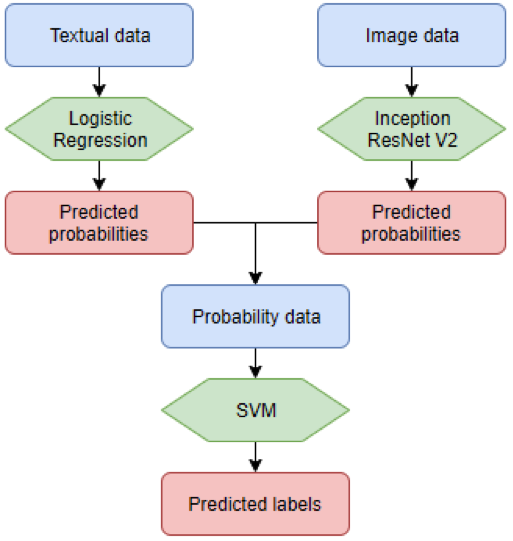
This stacking ensemble has enabled us to merge text and image data from our client, leading to an enhanced service and increased value for our partnership! This showcases merely one of the services we at Squadra Machine Learning Company provide; we invite you to explore our other offerings!
References
Džeroski, S., & Ženko, B. (2004). Is combining classifiers with stacking better than selecting the best one?. Machine learning, 54(3), 255-273.
Elberse, A. (2008). Should you invest in the long tail?. Harvard business review, 86(7/8), 88.
Graczyk, M., Lasota, T., Trawiński, B., & Trawiński, K. (2010, March). Comparison of bagging, boosting and stacking ensembles applied to real estate appraisal. In Asian Conference on Intelligent Information and Database Systems (pp. 340-350). Springer, Berlin, Heidelberg.
Joachims, T. (1998, April). Text categorization with support vector machines: Learning with many relevant features. In European conference on machine learning (pp. 137-142). Springer, Berlin, Heidelberg.
Kim, Y. G., Lee, T., Chun, J., & Lee, S. G. (2006). Modified naïve bayes classifier for e-catalog classification. In Data engineering issues in e-commerce and services (pp. 246-257). Springer, Berlin, Heidelberg.
Lahat, D., Adali, T., & Jutten, C. (2014, September). Challenges in multimodal data fusion. In Signal Processing Conference (EUSIPCO), 2014 Proceedings of the 22nd European (pp. 101-105). IEEE.
Ngiam, J., Khosla, A., Kim, M., Nam, J., Lee, H., & Ng, A. Y. (2011). Multimodal deep learning. In Proceedings of the 28th international conference on machine learning (ICML-11) (pp. 689-696).
Rokach, L. (2010). Ensemble-based classifiers. Artificial Intelligence Review, 33(1-2), 1-39.
Smith, L. N. (2017, March). Cyclical learning rates for training neural networks. In Applications of Computer Vision (WACV), 2017 IEEE Winter Conference on (pp. 464-472). IEEE.
Srivastava, N., & Salakhutdinov, R. R. (2012). Multimodal learning with deep boltzmann machines. In Advances in neural information processing systems (pp. 2222-2230).
