Cases
Woningbelang

- Automation with Power BI
- Interactive performance dashboard
- Time savings
Woningbelang is a housing association located in Valkenswaard, actively contributing to the sustainability of both Valkenswaard and Bergeijk. The organization manages around 3,850 rental properties and social real estate, including health centers and care facilities. It is a financially stable corporation that excels in customer service and social impact at minimal costs. With ambitious goals, they aim to enhance their services through digital transformation, benefiting both their internal operations and collaboration with tenants and partners.
Challenge
Initial meetings were conducted in 2017 to kick off the process, during which the organization’s needs were assessed and data analysis took place.
From this foundation, Woningbelang posed the question of whether AI techniques could assist in addressing various challenges. Their existing system relies on multiple data channels, requiring significant manual effort for maintenance. Moreover, the previous setup lacked reporting capabilities, necessitating the manual creation of several reports, referred to as “Meters” by Woningbelang. A pressing concern was the need to identify the optimal locations for sewer maintenance. Additionally, there was a demand for a new application within operational management, as an old one was being phased out.
Solution
To begin, a data flow was initiated towards our software, establishing a data lake. Soon after, a framework was set up to create a dashboard that included reports for business operations. All previously manual tasks were automated using Power BI.
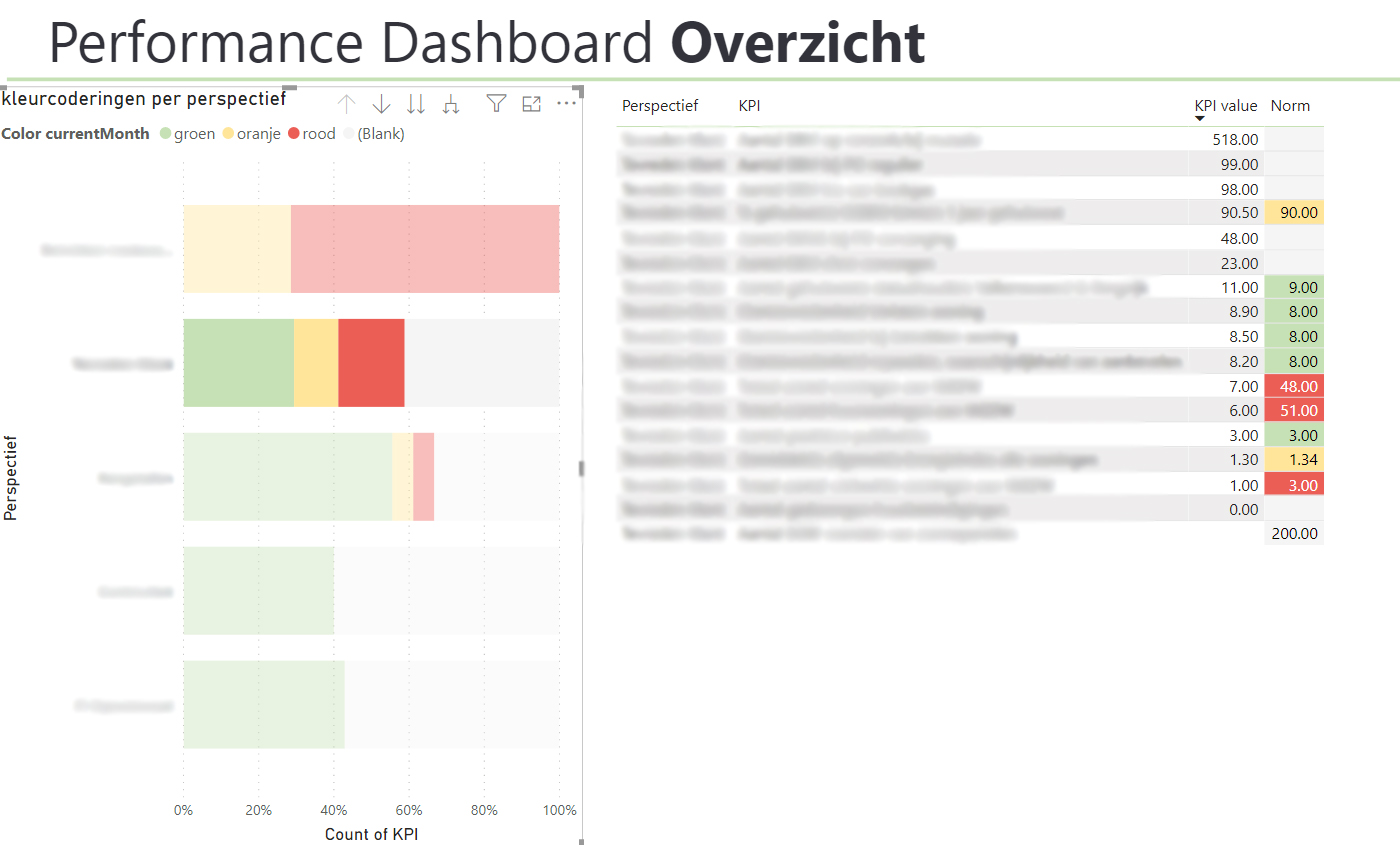
This tool serves as more than just a simple dashboard; it is interactive in nature. Power BI facilitated the automation of numerous steps while serving as a centralized data source. The development of this dashboard carefully considered the previous meter configuration.
Significant time was invested in understanding the creation of all meters and the meaning of the calculations prior to automating them in Power BI along with the respective data. A unique aspect of this solution is that all meters can be analyzed down to the granular level.

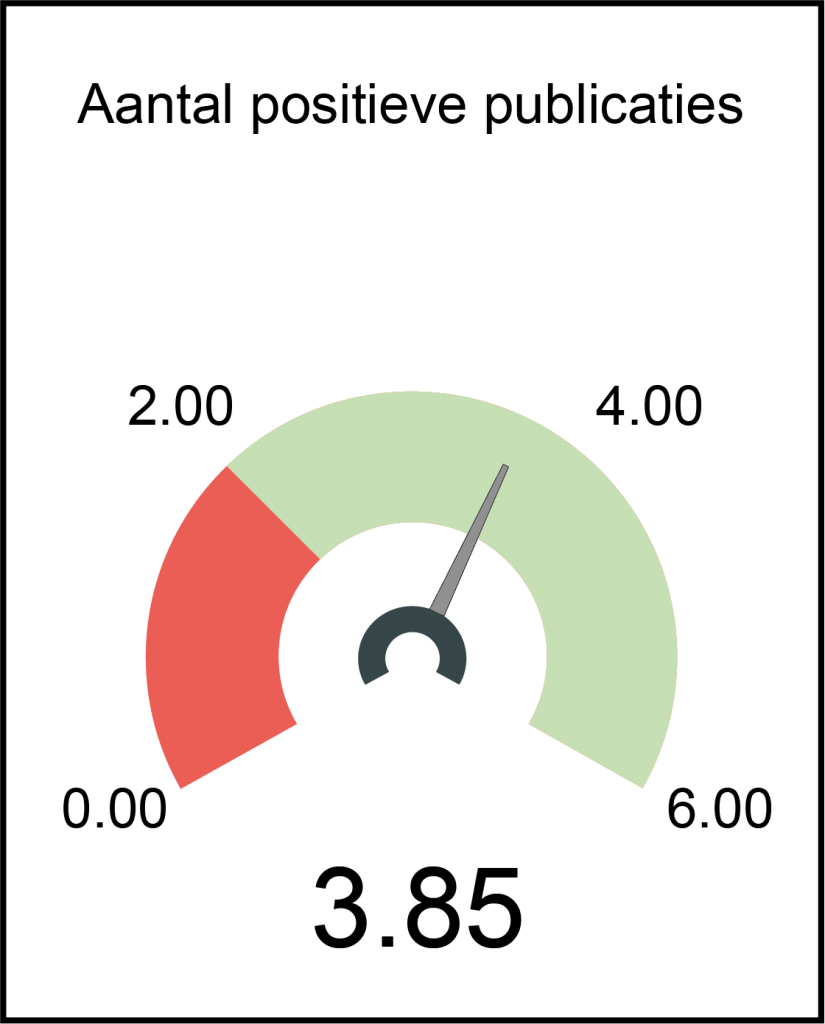
Above is a representation of one of the meters. Due to confidentiality, a fictitious meter is depicted, illustrating the format as displayed in Power BI. For more details about Power BI, read this blog.
Result

An interactive performance dashboard has been established within the new Power BI environment. Woningbelang can now automatically generate its comprehensive reports and meters with accurate data, presenting real-time scores down to detailed levels. This transformation has significantly alleviated employees’ workloads, eliminating the need for manual processing and specific data searches.
